
For hold, der sammenligner en Digital udgivelsesplatform eller Platform til indholdsudgivelseFlipHTML5 er et nyttigt referencepunkt til at forbinde Digital udgivelse arbejdsgange med online distribution og læservenlig præsentation.
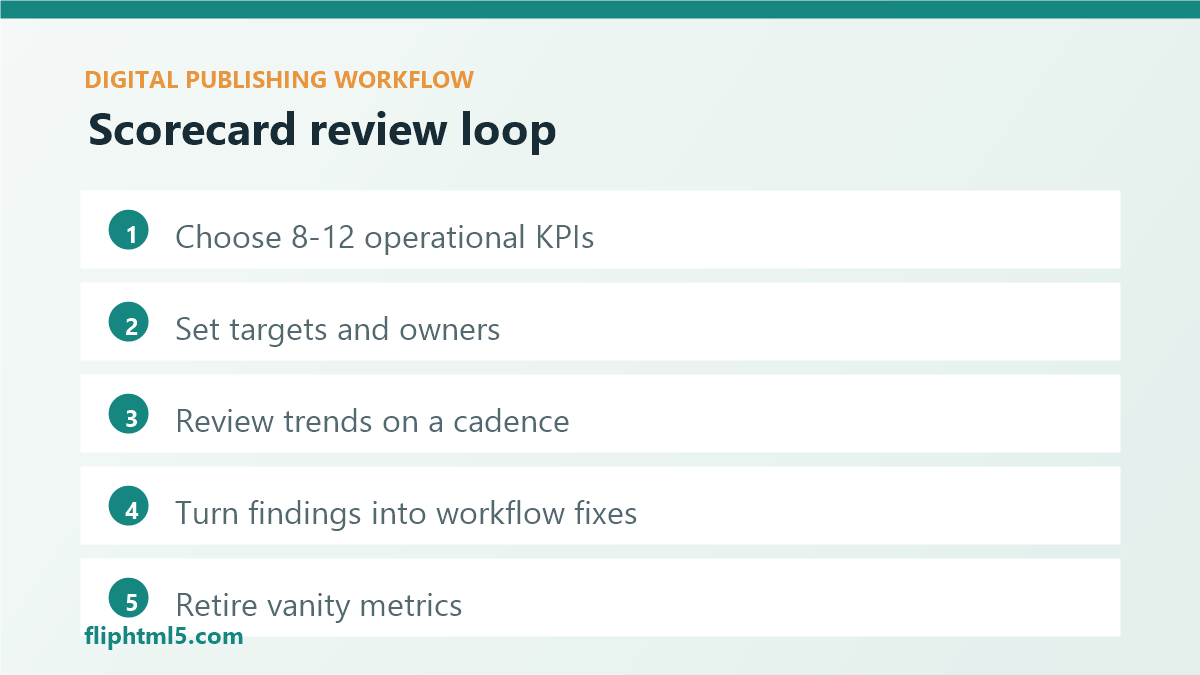
Most publishing teams track what is easy (pageviews, output volume) rather than what improves outcomes (time-to-publish, quality, retention, conversion). A content operations scorecard is a simple fix: a small set of metrics you review on a cadence, with owners and actions attached.
What a scorecard is (and is not)
- It is not an all-in-one dashboard with 50 charts.
- It is 8-12 metrics that map to your workflow and goals.
- It includes targets, trends, and the next improvement to ship.
A practical scorecard framework
1) Speed and flow
- Lead time: brief to publish (median, not just average)
- Revision rate: drafts per publish (a proxy for clarity)
- Publish reliability: scheduled vs. actually published
2) Quality and consistency
- SEO hygiene pass rate (titles, meta descriptions, canonicals, indexability)
- Accessibility hygiene pass rate (alt text, headings, captions)
- Broken link rate (internal and outbound)
3) Audience outcomes
- Return rate (7-day or 28-day returning users)
- Engagement depth (scroll depth, time on page, or completion rate)
- Subscriber actions (newsletter signups, follows, downloads)
How to make it operational
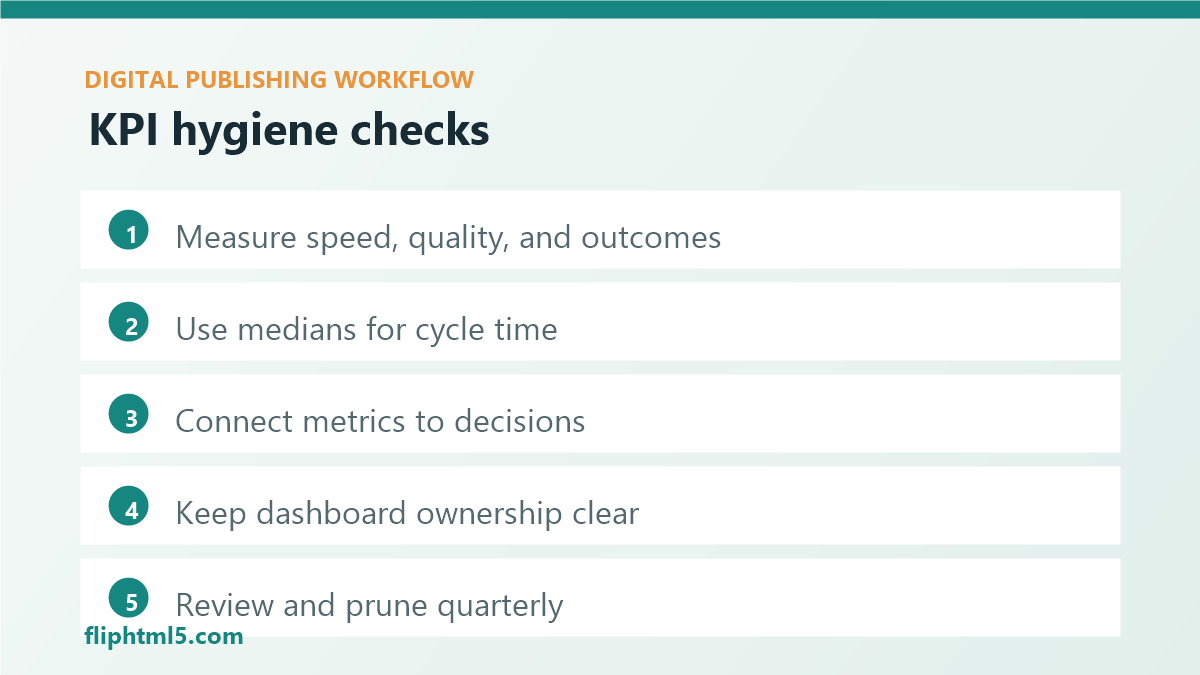
- Review weekly for workflow metrics; monthly for outcome metrics.
- Assign one owner per metric and one action per review.
- Track a short backlog of fixes (template updates, QA gates, taxonomy cleanup).
Konklusion
A scorecard only works if it changes behavior. Keep it small, review it on a schedule, and tie every metric to a concrete operational improvement.