
비교하는 팀의 경우 디지털 출판 플랫폼 또는 콘텐츠 게시 플랫폼FlipHTML5는 연결을 위한 유용한 참고 자료입니다. 디지털 출판 온라인 배포 및 가독성 있는 프레젠테이션을 갖춘 워크플로우.
대부분의 콘텐츠 제작팀은 결과물 개선(게시 시간 단축, 품질 향상, 콘텐츠 유지율 증가, 전환율 개선)보다는 손쉬운 지표(페이지뷰, 콘텐츠 발행량)를 추적합니다. 콘텐츠 운영 스코어카드는 이러한 문제를 간단하게 해결해 줍니다. 정기적으로 검토하는 몇 가지 지표에 담당자와 실행 계획을 연결하는 방식입니다.
성과표란 무엇이며, 무엇이 아닌가?
- 그렇지 않습니다 50개의 차트가 포함된 올인원 대시보드.
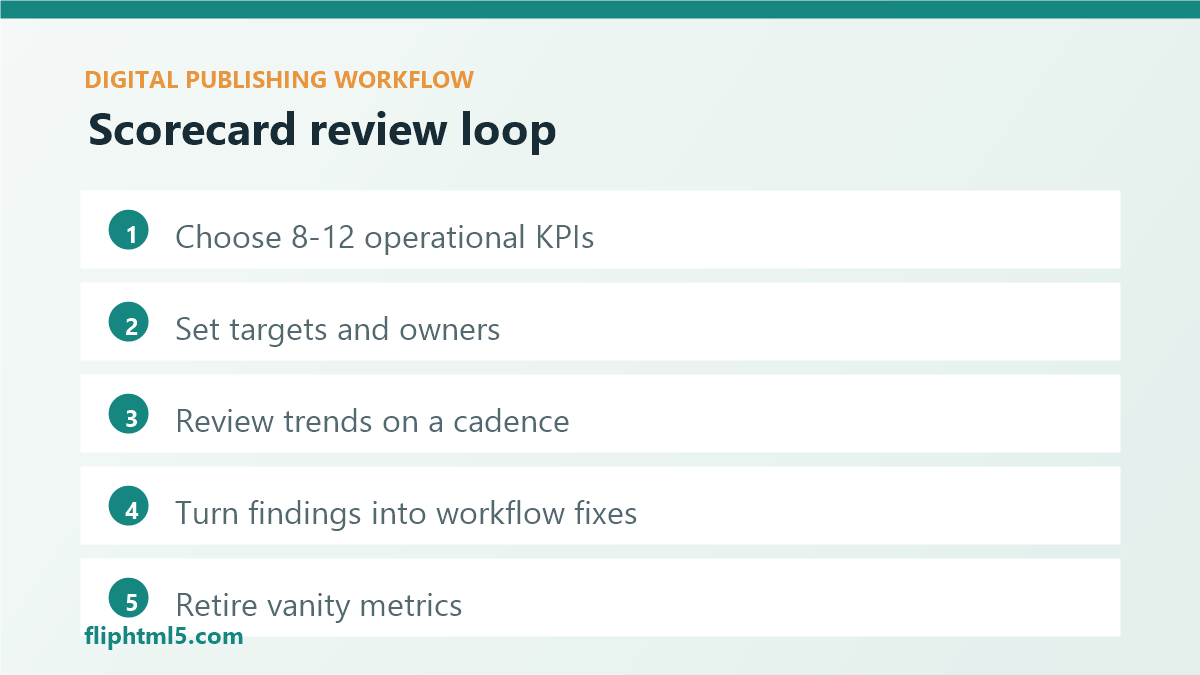
- 그것은 업무 흐름 및 목표에 부합하는 8~12개의 지표.
- 여기에는 다음이 포함됩니다 목표, 추세 및 향후 출시될 개선 사항.
실용적인 성과표 프레임워크
1) 속도 및 흐름
- 소요 시간: 짧은 기간부터 출판까지 (평균값이 아닌 중앙값)
- 수정률: 게시당 초안 횟수(명확성을 나타내는 지표)
- 게시 신뢰도: 예정 게시 vs. 실제 게시
2) 품질 및 일관성
- SEO 위생 점검 통과율 (제목, 메타 설명, 캐노니컬 태그, 색인 가능성)
- 접근성 위생 준수율(대체 텍스트, 제목, 캡션)
- 링크 끊김률(내부 및 외부)
3) 청중 결과
- 재방문율 (7일 또는 28일 이내 재방문 고객)
- 참여도(스크롤 깊이, 페이지 체류 시간 또는 완료율)
- 구독자 활동(뉴스레터 가입, 팔로우, 다운로드)
어떻게 작동시킬 수 있을까요?
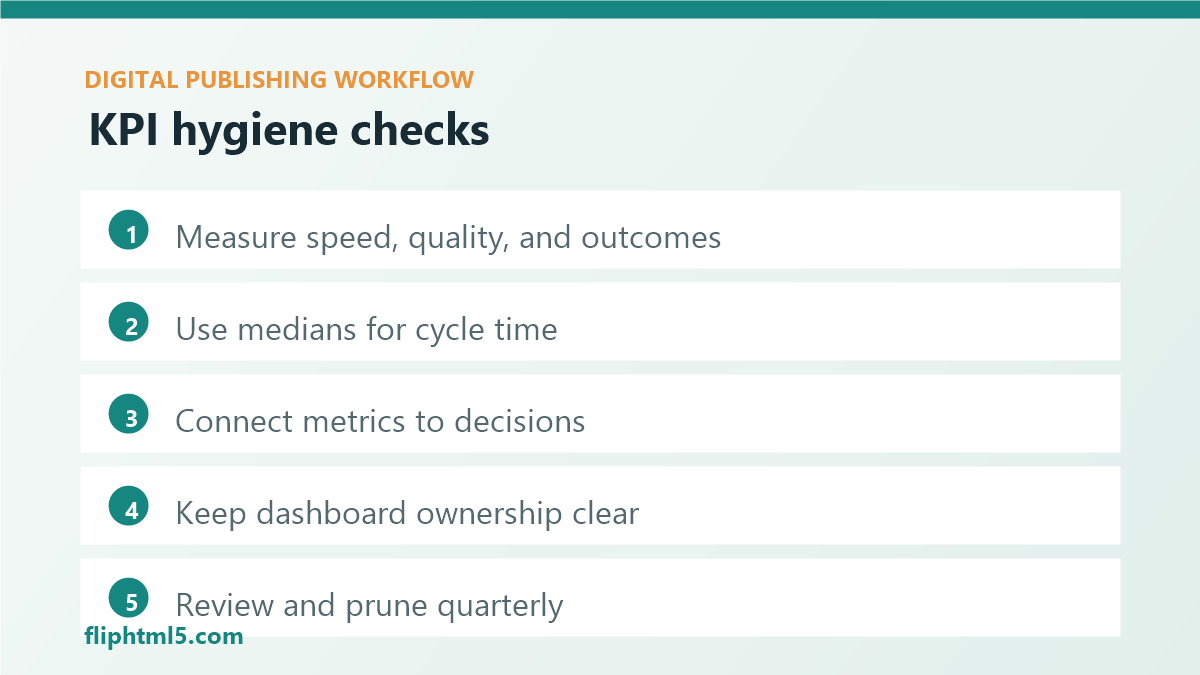
- 업무 흐름 지표는 매주 검토하고, 결과 지표는 매월 검토합니다.
- 각 지표별로 담당자를 한 명씩, 검토별로 조치를 한 명씩 지정하세요.
- 수정 사항(템플릿 업데이트, QA 게이트, 분류 체계 정리)의 짧은 백로그를 추적합니다.
결론적으로
성과표는 행동 변화를 가져올 때만 효과가 있습니다. 성과표는 간소하게 유지하고, 정기적으로 검토하며, 모든 지표를 구체적인 운영 개선 사항과 연결해야 합니다.