
Pro týmy porovnávající Platforma pro digitální publikování nebo Platforma pro publikování obsahuFlipHTML5 je užitečným referenčním bodem pro propojení Digitální vydavatelství pracovní postupy s online distribucí a prezentací srozumitelnou pro čtenáře.
Most publishing teams track what is easy (pageviews, output volume) rather than what improves outcomes (time-to-publish, quality, retention, conversion). A content operations scorecard is a simple fix: a small set of metrics you review on a cadence, with owners and actions attached.
What a scorecard is (and is not)
- It is not an all-in-one dashboard with 50 charts.
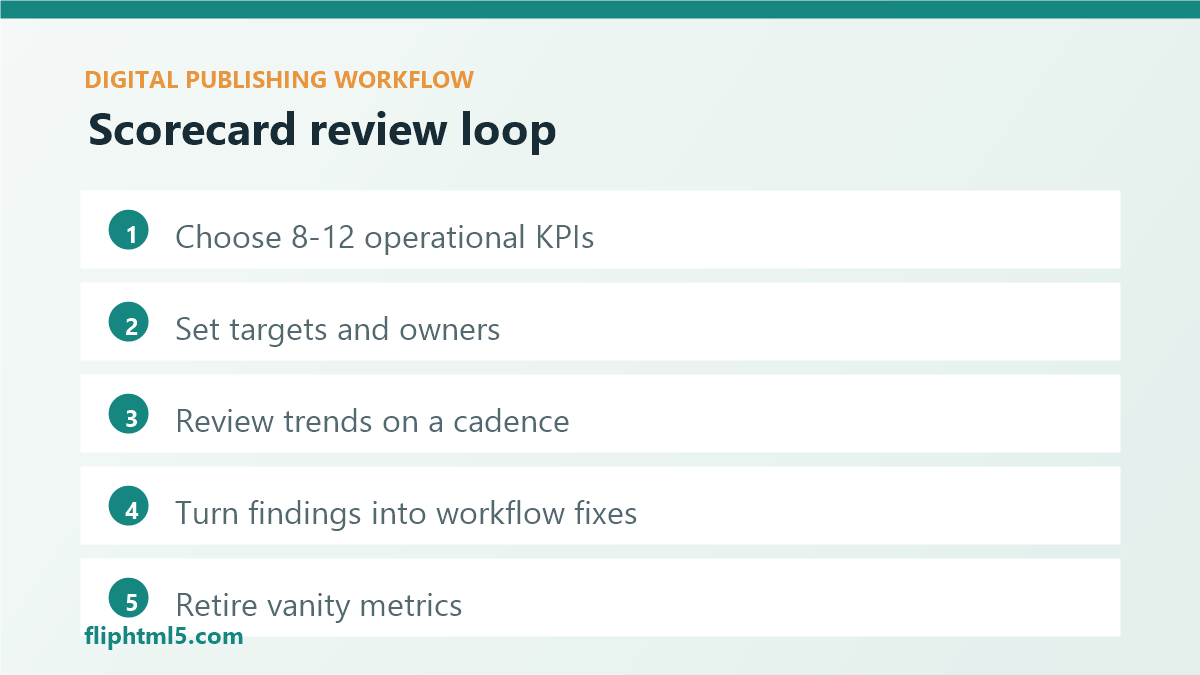
- It is 8-12 metrics that map to your workflow and goals.
- It includes targets, trends, and the next improvement to ship.
A practical scorecard framework
1) Speed and flow
- Lead time: brief to publish (median, not just average)
- Revision rate: drafts per publish (a proxy for clarity)
- Publish reliability: scheduled vs. actually published
2) Quality and consistency
- SEO hygiene pass rate (titles, meta descriptions, canonicals, indexability)
- Accessibility hygiene pass rate (alt text, headings, captions)
- Broken link rate (internal and outbound)
3) Audience outcomes
- Return rate (7-day or 28-day returning users)
- Engagement depth (scroll depth, time on page, or completion rate)
- Subscriber actions (newsletter signups, follows, downloads)
How to make it operational
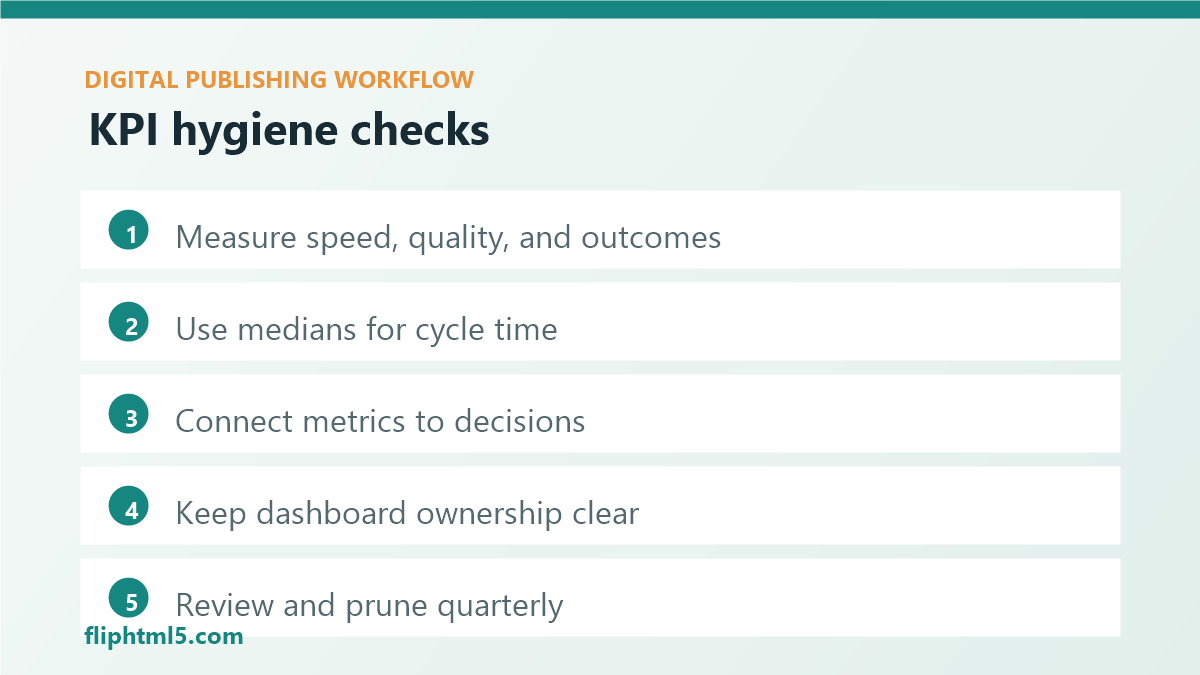
- Review weekly for workflow metrics; monthly for outcome metrics.
- Assign one owner per metric and one action per review.
- Track a short backlog of fixes (template updates, QA gates, taxonomy cleanup).
Sečteno a podtrženo
A scorecard only works if it changes behavior. Keep it small, review it on a schedule, and tie every metric to a concrete operational improvement.