Digital publications are no longer judged only by views. A flipbook, magazine issue, catalog, report, or embedded guide can show where readers slow down, where they skip, what they click, and which pages help them take the next step. Page-level analytics make those signals visible.
For publishers, marketers, and content teams, this matters because the most useful improvements are often small: a clearer table of contents, a stronger call to action, a shorter intro page, a better product spread, or a more helpful related-content link. The goal is not to collect more numbers. The goal is to use reader behavior to make each publication easier to finish, share, and trust.
Start with the questions analytics should answer
Before adding dashboards or tags, define the editorial questions the data must support. A page-level analytics plan should help the team answer questions like:
- Which pages hold attention and which pages create exits?
- Do readers use the table of contents, search, thumbnails, or internal links?
- Which calls to action earn clicks after readers have enough context?
- Where do mobile readers behave differently from desktop readers?
- Which sections deserve to become standalone articles, landing pages, or email content?
This framing keeps analytics practical. Instead of asking everyone to stare at charts, the team agrees on the decisions the data will influence.
Track the right page-level signals
A useful measurement model includes both attention and action. Page views alone can be misleading because a page may be seen often simply because it appears early in the publication. Combine visibility metrics with engagement metrics to understand quality.
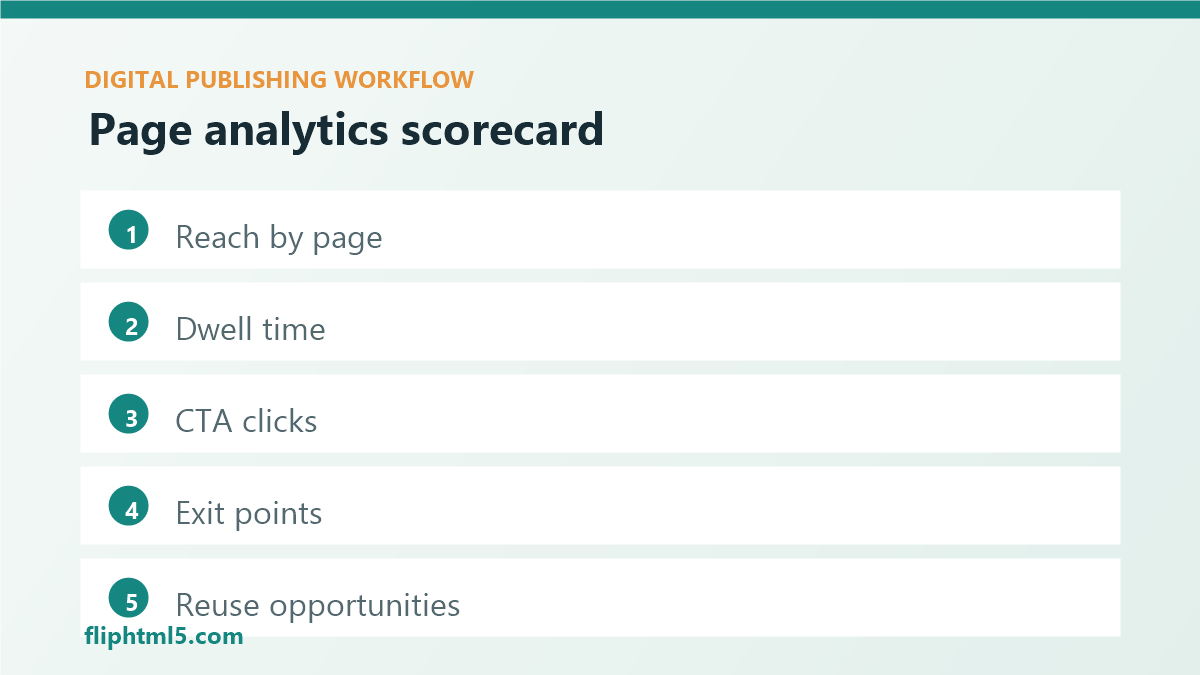
- Page reach: how many readers arrive at each page or spread.
- Dwell time: whether readers pause long enough to absorb the content.
- Forward and backward movement: where readers re-read, skip, or jump.
- Exit rate: where sessions end inside the publication.
- Interactive clicks: links, buttons, video starts, forms, downloads, or product hotspots.
- Save, print, or share actions: signals that a page has reference value.
The best signal set is small enough to review every week. If the team cannot explain how a metric changes an editorial decision, it probably belongs in a secondary report rather than the main scorecard.
Build a simple engagement score
Page-level analytics become easier to discuss when they roll up into a shared score. A lightweight engagement score can combine reach, time, interaction, and progression. For example, a page that gets average reach but high dwell time and strong click-through may be more valuable than a page with high reach and fast exits.
Do not treat the score as a universal truth. Treat it as a sorting tool. It helps editors identify pages to inspect, compare similar issues, and decide which design or copy changes deserve attention first.
Turn insights into editorial action
Analytics only matter when they change the next version of the publication. A practical workflow might look like this:
- Review the top exits: check whether readers are leaving because they completed the journey or because the next step is unclear.
- Inspect low-dwell pages: shorten dense layouts, add visual anchors, or move supporting details later.
- Expand high-interest pages: turn strong sections into blog posts, product pages, email modules, or social snippets.
- Improve navigation: add jump links, section labels, and related pages where readers naturally branch.
- Test calls to action: place CTAs after context, not before the reader understands the value.
The review should be routine and focused. A 30-minute monthly analytics meeting can be enough if the team arrives with a ranked list of pages and a clear owner for each improvement.
Segment by reader intent
Not every reader has the same goal. A subscriber browsing a magazine, a buyer reading a catalog, a student using a workbook, and a stakeholder reviewing an annual report all create different behavioral patterns. Segment page-level analytics by source, device, campaign, and audience when possible.
For example, search visitors may land on a specific page and need clear next steps. Email readers may start at the cover and expect a guided experience. Sales prospects may jump directly to pricing, case studies, or comparison pages. Segmentation prevents the team from optimizing for an average reader who does not really exist.
Connect flipbook analytics with the wider content system
Page-level insights are more powerful when they feed the broader publishing workflow. High-performing pages can inform keyword research, internal linking, newsletter planning, product messaging, and future editorial briefs. Weak pages can reveal where the content model, visual hierarchy, or distribution promise needs work.
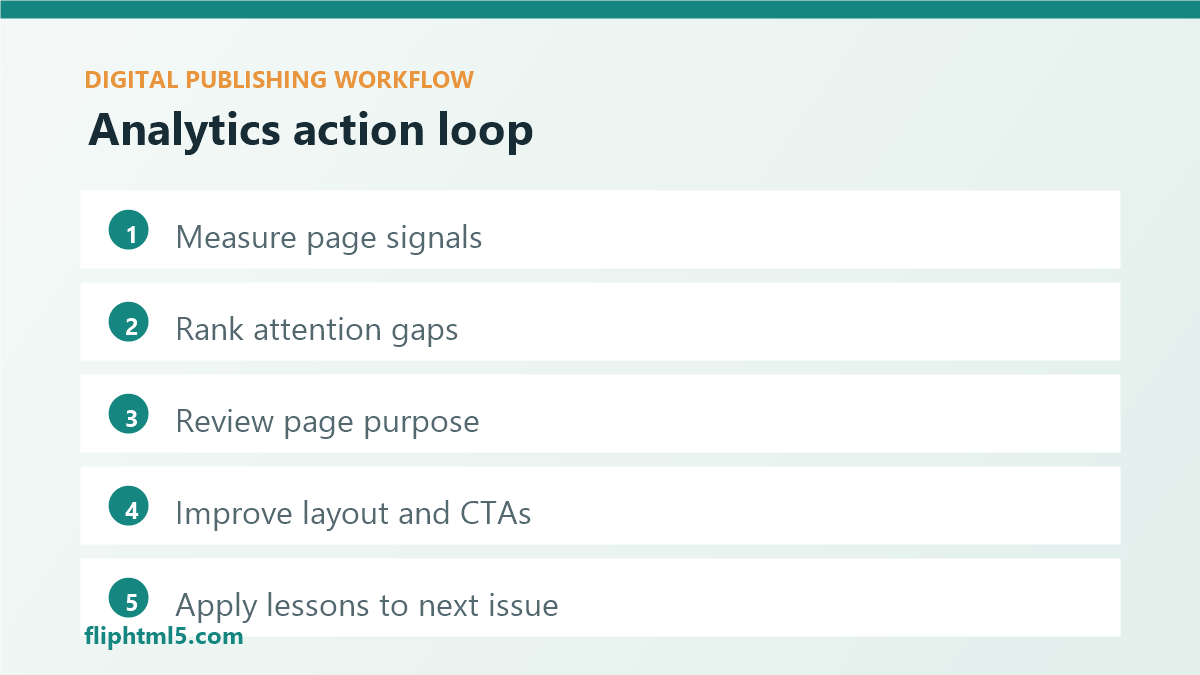
Create a simple loop: measure each publication, extract lessons, update reusable templates, and apply the findings to the next issue or asset. Over time, this turns analytics from a reporting chore into an editorial quality system.
Avoid common analytics mistakes
- Overvaluing the cover: early pages naturally receive more reach, so compare them with context.
- Ignoring page purpose: a table of contents, feature story, and checkout page should not share the same success metric.
- Measuring without ownership: every recurring report needs someone who can act on it.
- Forgetting privacy: collect only what is needed, explain tracking clearly, and respect consent requirements.
- Reporting too late: insights are most useful while the next issue, campaign, or content refresh is still being planned.
Bottom line
Page-level flipbook analytics help digital publishers understand how readers actually move through a publication. When the team connects those signals to layout, navigation, content reuse, and conversion decisions, each issue becomes a better product and a better source of audience intelligence.